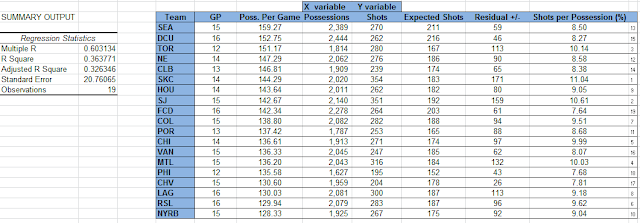
At this point in the MLS season we have enough data to run some more meaningful analysis. This post is meant to test the TFS hypothesis that shots and possessions should be positively correlated and that there is no benefit to being a more deliberate or more direct team.
As can be seen from the results below, there is some support for this hypothesis. There is a positive correlation between shots and possessions, though of course it is not perfect. I sorted teams by Possessions Per Game (PPG) in order to demonstrate that efficiency (measured by shots per possession) shows no correlation with the style a team plays (as measured by PPG). Also notice that the residuals from the best fit line created are the same as TFS's Shots per Possession (AG) ratings. In short, efficiency is paramount.

I'm confused. How can Shots Per Possession be greater than 1? Is this a percentage? You seem to indicate a higher number is better which would make sense if this was a possession?
ReplyDeleteAlso, I'm not understanding your point that possession and shots on goal are the only thing that matter to winning games, not style. I believe that style (direct versus deliberate as say) can affect the number of possessions and shots on goal. Many other factor can affect possession and shots like age of the players, height of the players, coaches nationality, etc. To say that these things do not matter to winning games is to confuse your point, I believe. Rather I'd prefer if you said that these things do not matter to winning games insofar as they don't affect possession and shots... then I can wrap my head around what your point is.
I like the analysis though... keep it coming.
Sorry for the confusion. I have updated the graph. Those #'s are shots per possession as a % (i.e. 8 = 8% of possessions have shots).
ReplyDelete