Overview
I believe that framing things on a per possession basis in soccer is an effective way to evaluate teams and players. What TFS attempts to answer is: When you have possession, what do you do with it? Do you score? Do you turn it over? What do your opponents do when they have possession?
Borrowing heavily from tempo-free statistics pioneers Ken Pomeroy and Dean Oliver, who have done excellent work with basketball, all statistics are framed on a per possession basis. Luckily for Pomeroy and Oliver, it is relatively easy to determine what constitutes a possession in basketball. Soccer is much more tricky.
Possession
Would-be soccer statisticians have long been flummoxed by the lack of available statistics. In recent years however, companies such as OPTA have taken on the large task of compiling a more comprehensive look at a game. Indeed, it is OPTA's game reports for MLS that form the basis of these rankings.
My starting point is the "Tackled, Possession Lost" (TPL) metric. TPL is assessed for any errant pass, interception, failed dribble, etc. A typical total for a team is between 120 and 160 a game.
The second component in determining the number of possessions is the "Clearances" (C) metric. According to OPTA, all Clearances are TPL, but not all clearances are changes in possession. For example, if a defender clears the ball out of bounds, then the team that originally lost the ball never really lost possession. Therefore, the number of Clearances, less Clearances where the defense maintains possession, is subtracted out of the TPL total. This subtotal is the number of Turnovers Committed.
Since it is Tempo-Free Soccer's opinion that all possessions end in either a Turnover or an "Attempt on Goal" (AOG), the equation for Possessions can be written as:
Possessions = TPL - C + AOG
One problem with the Tempo-Free soccer analysis is that very rarely will the number of possessions each team has equal each other. That said, the difference rarely exceeds 10 and is often closer to 5. Over the course of the season the disparity appears to sort itself out. The reasons for the consistent disparities are instances of "double possessions": a player may lose possession of the ball but it is adjudged to have gone off the other team, an attempt on goal is rebounded and another attempt is made, etc. It is my belief that even if a discerning eye were to go back over the entire 90 minutes, a complete reconciliation would be nearly impossible.
Expected Goals
EG = (AOG X Conversion %) + (SOG X Conversion %)
2
EG is a general metric taking the two major components of scoring goals (AOG, SOG) into consideration. Its aim is to roughly predict a team's expected goals scored per possession and goals allowed per possession. Conversion rates (Goals/AOG and Goals/SOG) are highly variable from team to team in a single season but generally consistent over time. Therefore, creating more opportunities than your opponent on a consistent basis is the primary driver to having a positive goal differential, winning soccer games, and accruing more points over the course of a season.
EG is derived by calculating the league average conversion rates for AOG and SOG and then assuming each team converts at the league average. At this point, I am weighting AOG and SOG equally, but this may be subject to change.
Luck
Luck = Points Per Match - Expected Points Per Match
For some reason, a long time ago someone decided that a win should count for three points, a draw for one, and a loss as zero. Margin of victory matters not one bit (except in case of tiebreaker). From a statistical point of view, the win/loss/draw system is silly human artifice. Some teams benefit from it (winning close games) and others do not.
Expected Points Per Match are calculated by creating a best fit line where Goal Differential is the X variable and Points Per Match are the Y variable.
Showing posts with label MLS Statistics. Show all posts
Showing posts with label MLS Statistics. Show all posts
Monday, March 4, 2013
Friday, January 4, 2013

Thursday, June 21, 2012
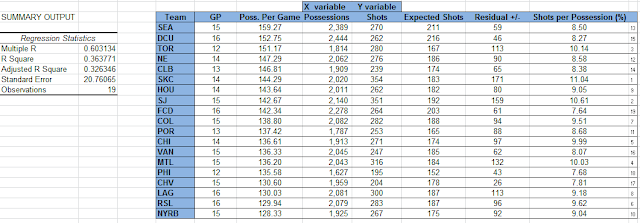
Possessions and Shots: An MLS Case Study
It is TFS's belief that the style a team plays does not particularly matter (all due respect to Barcelona lovers). What really matters is, when you have possession, do you create chances and score goals? When your opponent has possession, do you stop them from creating chances and scoring goals?
At this point in the MLS season we have enough data to run some more meaningful analysis. This post is meant to test the TFS hypothesis that shots and possessions should be positively correlated and that there is no benefit to being a more deliberate or more direct team.
As can be seen from the results below, there is some support for this hypothesis. There is a positive correlation between shots and possessions, though of course it is not perfect. I sorted teams by Possessions Per Game (PPG) in order to demonstrate that efficiency (measured by shots per possession) shows no correlation with the style a team plays (as measured by PPG). Also notice that the residuals from the best fit line created are the same as TFS's Shots per Possession (AG) ratings. In short, efficiency is paramount.

Friday, June 15, 2012
Mind the Net: The LA Galaxy and Their Goalkeeping (Problem)
It's hard being a goalkeeper. I remember when I used to play competitively in my youth our goalkeeper would always cry when he gave up a goal, as if he had let the whole team down. It is an unenviable task, being held accountable to make amazing saves look routine.
That said, it is apparent to anyone who has seen the reigning MLS Champion Los Angeles Galaxy play this season that their goalkeeping has been poor. Very poor. How bad? Well, let these statistics tell the tale. I looked at every goalie in the MLS who had started at least three games. I then subtracted all penalties from their statistics because they distort a goalie's save percentage (saves/shots on goal). Here is what I found:

It obviously doesn't look very good for the Galaxy goalkeepers. I understand that not every shot on goal is created equal and that it is up to the defense to make it difficult for an offense to score. However, you need look no further than the difference between Bill Hamid and Joe Willis of DC United to see how important a goalie can be: Hamid had more saves in three less games started than Willis while allowing just over a third the number of goals. Yea, goalkeeping matters.
I took it a step further with the Galaxy and wanted to know what would happen if they had an average MLS goalie (Donovan Ricketts?) as opposed to the TWO WORST goalies in MLS?

So what is the verdict? Nearly five more goals allowed over the season (.37 a game) than is necessary. People can talk all they want about how Donovan or Keane or Beckham or Buddle is not performing up to expectations. Or how Omar Gonzalez' injury has decimated their defense, but the evidence seems pretty clear to this point that the LA Galaxy have a pretty big goalkeeping problem that they better figure out soon. That is, if they want to make the MLS Playoffs, let alone repeat as champions.
Subscribe to:
Posts (Atom)